SUMMARY
Benchmarking your firm’s financial and operating performance provides valuable strategic information to help answer some important questions: Where do you excel and where to you fall short compared to your competitors? Are your strategic initiatives delivering expected results over time? How is your most valuable resource — your staff team — being used? Are you carrying too much overhead? Shimmerman Penn’s Architecture, Engineering and Design (AED) speciality group understands the key industry financial metrics needed to benchmark firms’ performance.
Efficiency metrics concentrate on the operational efficiencies of your business. Efficiency metrics provide a deeper analysis as compared to performance metrics. Shimmerman Penn’s favored efficiency metric is the Overhead Rate. In this second instalment of the 2017 Update of key performance indicators for AED firms we will discuss the Overhead Rate metric. Overhead rate measures a firm’s ratio of overhead (indirect costs) to its direct labour costs. This metric provides a measure of how efficiently the firm’s cost structure is setup and can be used to budget and allocate indirect costs to a project. The Overhead Rate provides information on the firm’s overhead costs per dollar of professional labour. Experience will show the correct level for each firm.
FORMULA: Overhead rate = (Overhead) / (Direct labour)
Overhead
Overhead costs are ongoing “indirect” business expenses not including or related to direct labour, direct project costs and third-party expenses that are billed directly to customers. Overhead expenses include:
- fixed costs that do not vary with project activity (e.g. rent, insurance, administrative salaries, etc.) and
- variable costs (e.g. utilities, project costs, etc.).
In Shimmerman Penn’s calculations, firms’ annual overhead costs are “normalized” to remove bad debts expense, profit sharing bonuses and unusual one-time expenditures, less the firm’s direct salaries. Therefore, overhead costs will include indirect or administration labour costs and the related employee benefits.
Direct labour
In Shimmerman Penn’s calculations, we use “total professional labor, excluding the related employee benefits,” to factor out anomalies due to significant differences in utilization rates. This leads to results that are more comparable over time and across different firms. Other differences can arise from the components that are included in labour costs. Additional components of labour to consider include the following:
- Labour burden (employee benefits) — may be treated as labour or overhead costs
- Employee bonuses and overtime costs — may be included if directly related to project performance
- Pursuit costs — firms that are actively involved in P3 projects are tracking the component of labour expended on RFPs.
- Owners’ salaries should be normalized at market rates to reflect the contribution for professional services rendered and should exclude time spent managing the firm. Each firm will have its own internal benchmark.
- For firms structured as partnerships, the partners commonly do not receive salaries and a “notional” salary for contribution for professional services rendered should be included in labour costs.
There is no right or wrong way to calculate Direct labour, what’s important is that the specific methodology be applied consistently.
OVERHEAD RATE — 5 YEAR TREND AND ANALYSIS
Our methodology
Shimmerman Penn’s AED Industry Team compiled the data for the 2017 update based on annual financial results for 18 architecture and engineering client firms located within the GTA, for the fiscal years 2012—2016. We calculated the ratios for each firm, and then compiled the overall results using a weighted average related to each firm’s net fees.
Results and analysis
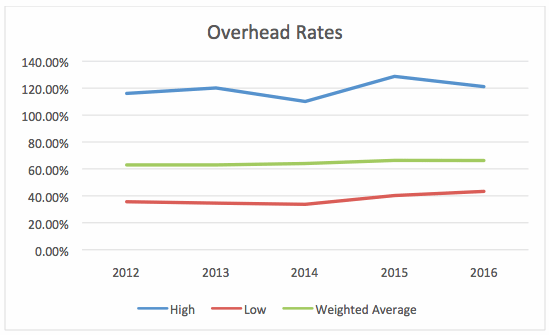
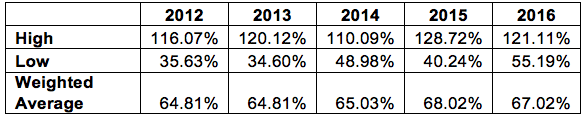
Pre-2012, Shimmerman Penn’s AED clients generally had overhead rates between 65%-70%. Due to price competition and general worries about the future economic outlook in 2009 and 2010 firms started to cut overhead costs to “trim the fat”. These cost reductions can be seen in the decrease in overhead rates in 2012 and 2013. Firm leaders and management learned that keeping an eye on overhead costs is very important and directly impacts the profitability of their firms. Although AED firms are still facing a very competitive market, the growth in the construction industry since 2011 has seen some firms increase their overhead costs back to established norms. This can be seen in years 2014 to 2016.
BENCHMARKING AND DECISION MAKING
How can calculating the Overhead rate be of use in your firm? We recommend that a financial dashboard be used to provide information to senior management and project managers on a regular, periodic basis. The ratio can be calculated internally on either a monthly, quarterly or annual basis. Many software platforms used by firms in this industry offer the ability to extract the data and calculate these ratios.
Benefits:
- Breaking down the components of overhead and tracking these costs over time can provide insights into where costs may be better managed and staff better utilized.
- Comparing to your firm’s performance over time can identify areas in which changes are occurring and assist in strategic planning and operational decision making.
- Comparing your firm against industry trends can help in strategic planning to identify areas in which changes could be made to improve profitability and efficiencies.
BENCHMARKING — YOUR FIRM’S RESULTS
Our AED team can prepare a financial dashboard to compare your firm’s results to our weighted average performance indictors and assist you to understand and analyze the information. We can assist your accounting staff to create internal reporting that captures the data from your accounting system, so that you can have these reports prepared on a regular basis.