Summary
Benchmarking your firm’s financial and operating performance provides valuable strategic information to help answer some important questions: Where do you excel and where to you fall short compared to your competitors? Are your strategic initiatives delivering expected results over time? How is your most valuable resource – your staff team – being used? Are you carrying too much overhead? Shimmerman Penn’s Architecture, Engineering and Design (AED) speciality group understands the key industry financial metrics needed to benchmark firms’ performance.
 There are 3 major categories of metrics that firms can use for benchmarking:
- Performance
- Efficiency
- Predictive
Our 2017 annual update provides useful information on these key AED industry metrics:
Change in Net Fee Revenues (performance)
Revenue growth is an important metric to track as firms that maintain a steady growth over the long term without sacrificing profitability will fare much better than their counterparts. A steady increase in revenue growth means that the firm is expanding, while a decrease in revenue growth will mean that the firm is in decline.
Net Fee Multiplier (performance)
The Net Fee Multiplier measures a firm’s ability to convert direct labour charged to projects into revenue dollars. It is an expression of the amount of net fees generated for each dollar of direct labour and is calculated by dividing the fees billed (net of subconsultants) by direct labour costs.
Overhead Rate (efficiency)
The Overhead Rate provides an indictor of the efficiency of the firm’s cost structure and is often used to allocate indirect costs to a project. The Overhead rate measures a firm’s ratio of overhead (non-project related costs) as a percentage of direct labour costs.
Profit to Net Fees Ratio (performance)
The Profit to Net Fees Ratio provides a measure of the firm’s effectiveness in completing projects profitably. It is determined by dividing the firm’s pre-tax profit by net fees. This ratio can be calculated on a project by project basis to assist in budgeting and evaluate the success of projects (micro), and also on a firm-wide level to evaluate the overall profitability of operations (macro).
Contract Backlog and Hit Ratio (predictive)
These two ratios are commonly used in strategic and operational planning. Key decision making includes the allocation of staff resources to pursuits and projects, the impact on cash flows and how to focus business development activities.
Benchmarking and Decision Making
How can these metrics be of use in your firm? We recommend that a financial dashboard be used to provide information to senior management and project managers on a regular, periodic basis. These ratios can be calculated internally on either a monthly, quarterly or annual basis. Many software platforms used by firms in this industry offer the ability to extract the data and calculate these ratios.
Benefits:
- Calculating the Net Fee Multiplier on a project-by-project basis provides useful information for evaluating efficiency and profitability of projects. This can be tracked by industry sector, project team, geographic region, etc. Compensation and performance bonus plans can be developed using these quantitative factors.
- Information regarding the firm’s historical Net Fee Multiplier can be used when developing project budgets and proposals, and in determining the optimum level of employee resources needed to staff the firm’s operations.
- Tracking the key components of the firm’s overheads, including the fixed and variable costs, can assist in budgeting for growth.
- Comparing to your firm’s performance over time can identify areas in which changes are occurring and assist in strategic planning and operational decision making.
- Comparing your firm against industry trends can help in strategic planning to identify areas in which changes could be made to improve profitability and efficiencies.
Our Methodology
Shimmerman Penn’s AED Industry Team compiled the data for the 2017 update based on annual financial results for 18 architecture and engineering client firms located within the GTA, for the fiscal years 2012 - 2016. We calculated the ratios for each firm, and then compiled the overall results using a weighted average related to each firm’s net fees. We further segmented the data set to calculate results for firms with net fees greater/less than $10M and found no significant differences based on the relative size of firms.We will provide an overview of the results. Over the next few months, we will publish more detailed analyses on each of these metrics, to provide deeper insights and guidance for strategic planning.
Benchmarking — Your Firm's Results
Our AED team can prepare a financial dashboard to compare your firm’s results to our weighted average performance indictors and assist you to understand and analyze the information. We can assist your accounting staff to create internal reporting that captures the data from your accounting system, so that you can have these reports prepared on a regular basis.
AED Industry Key Performance Ratios — 2017 Highlights
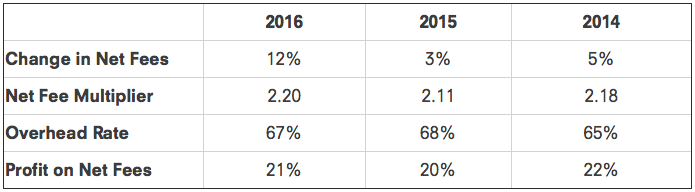
2016 was a successful year for many firms in the group. Notably, the overall increase in Net Fees of 12% was significant as compared to 2015, and much higher than in the past two years. This increase was across sectors among firms. The Net Fee Multiplier increased by 4% to 2.20 and remained in a healthy range. Generally, a Net Fee Multiplier of 2.0 and greater reflects a high level of efficiency and profitability in project management and outcomes.
Highlights
- Net Fees revenues increased by 12%
- The Net Fee Multiplier increased from 2.11 to 2.20
- The Overhead Rate decreased by 1% to 67%
- Profit to Net Fees increased by 1% to 21%
Many of these analytics are impacted not only by internal firm operational factors, but also by external factors such as industry trends, unique sectors in which firms participate, related industries and general economic trends. Architecture and engineering firms are directly impacted by trends in the construction industry. The resource below provides analysis and an overview of the construction industry outlook for the next 10 years.
Useful Resource: Construction Outlook for Ontario, 2017-2026
(Source: BuildForce Canada (excerpts) - Funded by the Government of Canada’s Sectoral Initiatives Program)
The outlook for Ontario projects that the pace of the construction expansion will slow over the coming decade, but continued migration to the province and rising infrastructure requirements are expected to sustain employment near record high levels.
Non-residential demand requirements related to major infrastructure projects are poised to become more prominent over the next 10 years, superseding residential as the primary source of construction growth in many regions across Ontario.
New housing construction has risen steadily over the last five years, adding more than 26,000 jobs since 2011. Over 2015 and 2016, new housing investment increased by 25 percent, propelled in large part by condo projects in and around the Greater Toronto Area (GTA). Though the pace is expected to slow, residential building still has momentum in many regions of the province. Activity is expected to stabilize after 2017, adding a projected 386,000 new housing units in the province over the next five years. Steady growth in renovation activity is expected to surpass new housing demands by 2018; a trend that is expected to continue across the remainder of the scenario period.
Non-residential construction is characterised by rising near-term demands related to major infrastructure and transportation projects and modest long-term growth in non-residential building and regional engineering requirements. Major projects, including an international bridge in Windsor, transit projects in the GTA and Ottawa, and major nuclear refurbishments projects in the GTA and Southwestern Ontario help sustain employment across the scenario period.
While the overall pace of growth slows compared to the recent past, sustaining capacity over the latter half of the scenario period will be made more difficult by the expected retirement of 86,000 workers over the decade (20 percent of the current workforce) against slower population growth and fewer youth available to enter the labour force. Attracting first-time new entrants to the industry will be crucial to offset expected retirements.