Overview
Architecture, engineering and design firm leaders are faced with many challenges including how to:
-
generate sustainable growth and profitability of the firm
-
build a capable and loyal employee team
-
develop future leaders
-
expand services
-
increase productivity, and
-
stay current with professional standards and new technologies.
Sustainable growth needs to be driven by healthy profits, while allowing the firm to build its culture and stay true to its purpose. There is a direct link between the firm’s financial performance and value. This is especially important when planning for internal employee succession.
Financial strength is achieved by coordinated efforts throughout the firm, from the leaders to the full staff team. On a macro level, the focus is on integrating new opportunities into the existing firm and culture. On a micro level, the focus is on close budgeting and monitoring projects and firm overheads. In addition, the compensation strategy for owners and employees is aligned with firm goals.
In December 2021, we ran a webinar to introduce this topic. This is a first in a series of articles that we will publish, to further explore the key financial metrics for the AED industry and how firm leaders can use Executive Financial Dashboards in strategic planning and employee succession plans:
-
Maintaining Financial Sustainability and Growing your Firm – Overview
-
Cash Flow Management: the Billing and Collection Cycle
-
Key Metrics: Professional Labour Costs and The Net Fee Multiplier
-
Key Metrics: Managing Overhead Costs
-
Key Metrics: Profits on Net Fees, Net Fees per Employee
-
Predictive Metrics
-
Using Financing Dashboards in Employee Succession Plans

Importance of Performance Benchmarking
Benchmarking your firm’s financial and operating performance provides valuable strategic information to help answer some important questions:
-
Where do you excel and where to you fall short compared to industry performance?
-
Are your strategic initiatives delivering expected results over time?
-
How is your most valuable resource – your staff team – being used?
-
Are you carrying a reasonable level of administrative personnel and overhead?
We will present a sample Executive Financial Dashboard of key financial metrics to help AED firm leaders align strategy with performance to build value, monitor and assess the financial health of their firms, manage day-to-day operations and set performance targets.
Owners are the main decision makers in the firm and they should have access to quality information on a timely basis, about the firm overall. Dashboards can also be used by project managers as they can benefit from timely information to help them in make decisions daily basis.
The key is to ensure the right people have access to the right information, and review metrics on a frequent basis, as a regular part of the ongoing business review process.
Comparing to your firm’s performance over time will help you identify areas in which changes are occurring and assist in strategic planning, risk management and operational decision making.
Comparing your firm’s results to industry trends will help in strategic planning to identify areas in which changes could be made to improve profitability and efficiencies, thereby increasing the firm’s overall value.
There are many different metrics that you can use to assess your business and there are numerous resources available online which provide industry data which you can compare your data to. What is important it to select key metrics provide the most meaningful information for your firm.
Creating an Executive Financial Highlights Dashboard
-
Create a dashboard that you can easily maintain, using project management software or Excel
-
Create a clean and predictable dashboard, using a mix of data, charts and color
-
Choose the most essential metrics to track
-
Keep the dashboard up-to-date and accurate, as the business may change over time
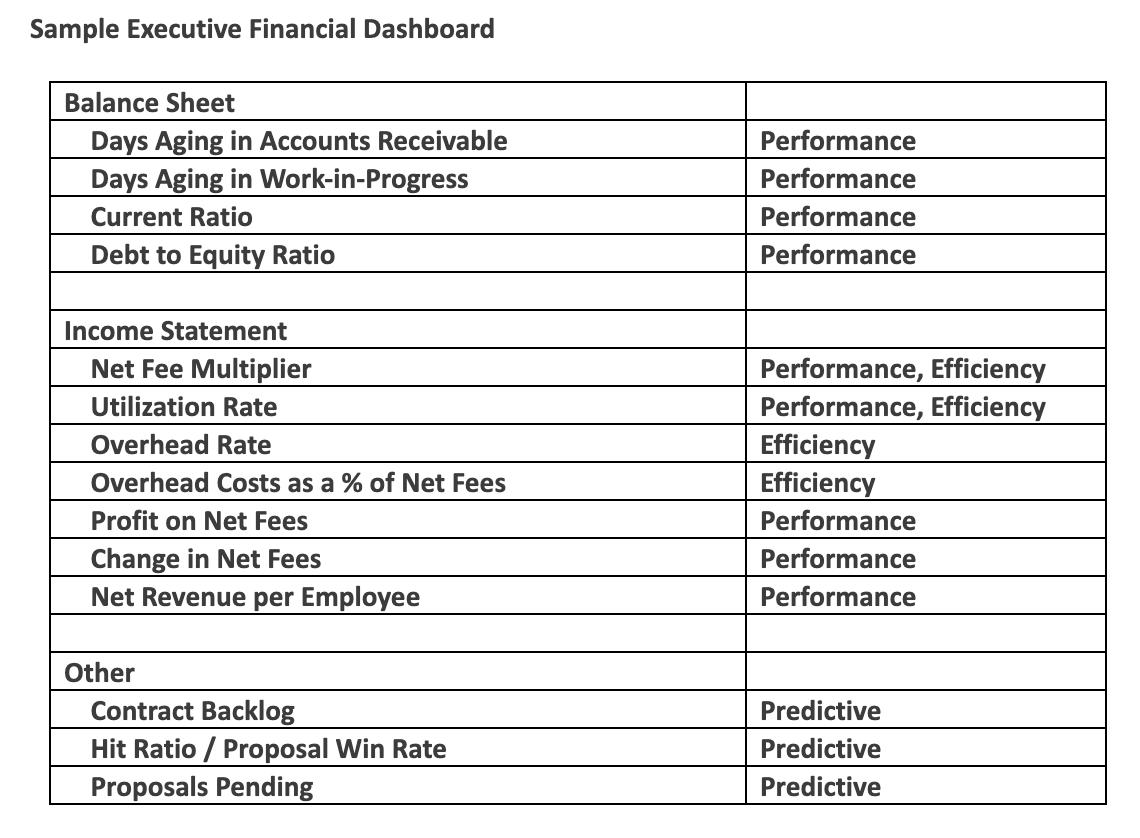
We will focus on 3 major categories of metrics that firms can use for benchmarking:
-
Performance
-
Efficiency
-
Predictive
It’s useful to organize metrics as they relate to the firm’s financial statements, which include the Balance Sheet and Income Statement. This will help build a connection between decision making and analysis, with financial reporting, and will allow the users to focus on the two key areas that are separate yet linked: understanding how to analyze profits and also determine whether the firm’s cash flow is at a healthy level, as both are tied to sustainability and building value.
Sample Executive Financial Dashboard
Highlights – More to Come
In our upcoming articles, we will take a deeper dive into these metrics, illustrate how they are calculated and discuss ways to analyze and interpret the results. These are selected highlights:
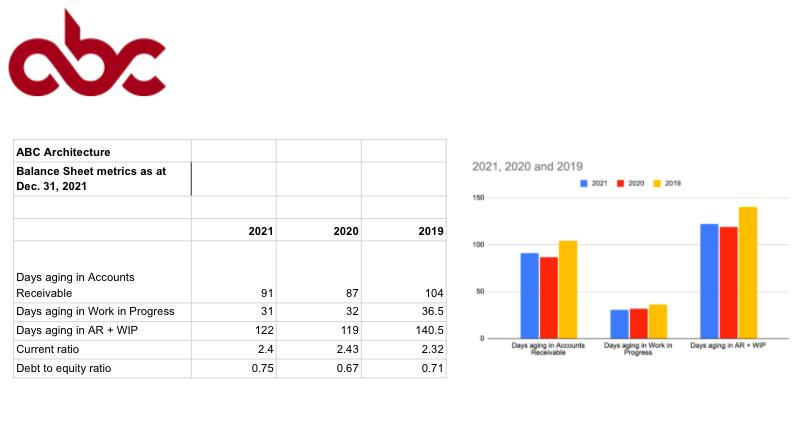
Accounts Receivable and Work-in-Progress Aging (Performance)
Managing the billing cycle and generating steady cash flow are key elements of a sustainable firm. The firm’s Accounts Receivable and Work-in-Progress represent labour costs not yet realized in cash. This directly impacts the firm’s financing needs and ability to distribute earning to owners.
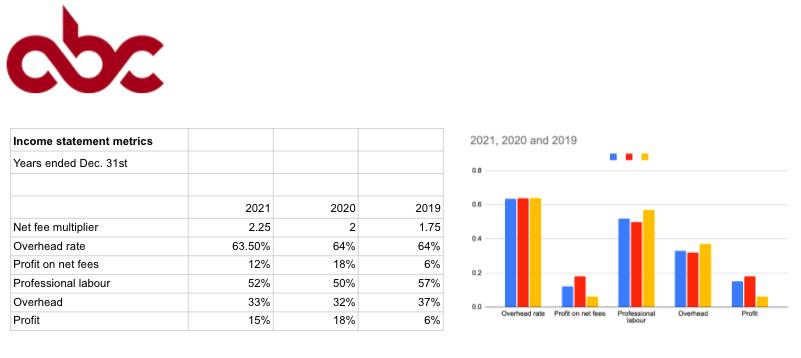
Net Fee Multiplier (performance, efficiency)
The Net Fee Multiplier measures the firm’s ability to convert professional labour charged to projects into revenue dollars. It is an expression of the amount of net fees generated for each dollar of professional labour and is calculated by dividing the fees billed (net of sub-consultants) by professional labour costs.
At the overall firm level, the Net Fee Multiplier provide excellent feedback to firm leadership to assist them in developing strategy for recruiting and retaining the professional staff team and in determining the optimum level of employee resources needed to staff the firm’s operations..
Calculating the Net Fee Multiplier on a project-by-project basis provides useful information for evaluating efficiency and profitability of projects. This can be tracked by industry sector, project team, geographic region, etc. Compensation and performance bonus plans can be developed using these quantitative factors.
Information regarding the firm’s historical Net Fee Multiplier can be used when developing project budgets and proposals.
Overhead Rate (efficiency)
The Overhead Rate provides an indicator of the efficiency of the firm’s cost structure and can be used to allocate indirect costs to projects. The Overhead rate measures the firm’s ratio of overhead (administrative personal and non-project related costs and business expenses) as a percentage of professional labour costs.
Tracking the key components of the firm’s overheads, including the fixed and variable costs, can assist in budgeting for growth.
Profit to Net Fees Ratio (performance)
The ratio of Profit to Net Fees Ratio provides a measure of the firm’s overall effectiveness in completing projects profitably as well as managing overheads. It is determined by dividing the firm’s pre-tax profits by net fees. This ratio can be calculated on a project by project basis to assist in budgeting and evaluate the success of projects (micro), and also on a firm-wide level to evaluate the overall profitability of operations (macro).
Change in Net Fee Revenues (performance)
Revenue growth is an important metric to track as firms strive to maintain a steady growth over the long term without sacrificing profitability. A steady increase in revenue growth means that the firm is expanding, while a decrease in revenue growth will mean that the firm is in decline. An analysis of revenue streams and types of projects will provide additional valuable information.
Contract Backlog and Hit Ratio (predictive)
These two ratios are commonly used in strategic and operational planning. Key decision making includes the allocation of staff resources to pursuits and projects, the impact on cash flows and how to focus business development activities. Using probability analysis, the firm can prepare cash flow analyses under various scenarios.
BENCHMARKING — YOUR FIRM'S RESULTS
Our senior AED team members develop Executive Financial Dashboards for our clients and provide insights on industry performance trends.